| If profound intractable problems exist in society, it follows that the professions needed to fix them have not yet been invented. Ian Wojtowicz (he/him) is a writer who builds stuff. His work applies techniques of connection, dissensus, modifiability, playfulness, editing, argument, dialogue, and repair. He has shown work in Hong Kong, Europe and throughout North America, and has published work in Wired Magazine, Atlantic Monthly, and on PBS and Discovery channels. Professionally, Wojtowicz has consulted for the Canadian Broadcasting Corporation, the US National Coast Guard Museum, the Redwoods National and State Parks, and indigenous cultural projects at Nk'Mip and Wanuskewin. Wojtowicz holds a degree in Art, Culture and Technology from MIT’s School of Architecture and is the editor of a collected volume from MIT Press entitled Interrogative Design, on artist Krzysztof Wodiczko's influential design philosophy. He currently lives and works in Vancouver, Canada, on the territories of the Squamish, Musqueam and Tsleil-Waututh people. |
Earth Doppler
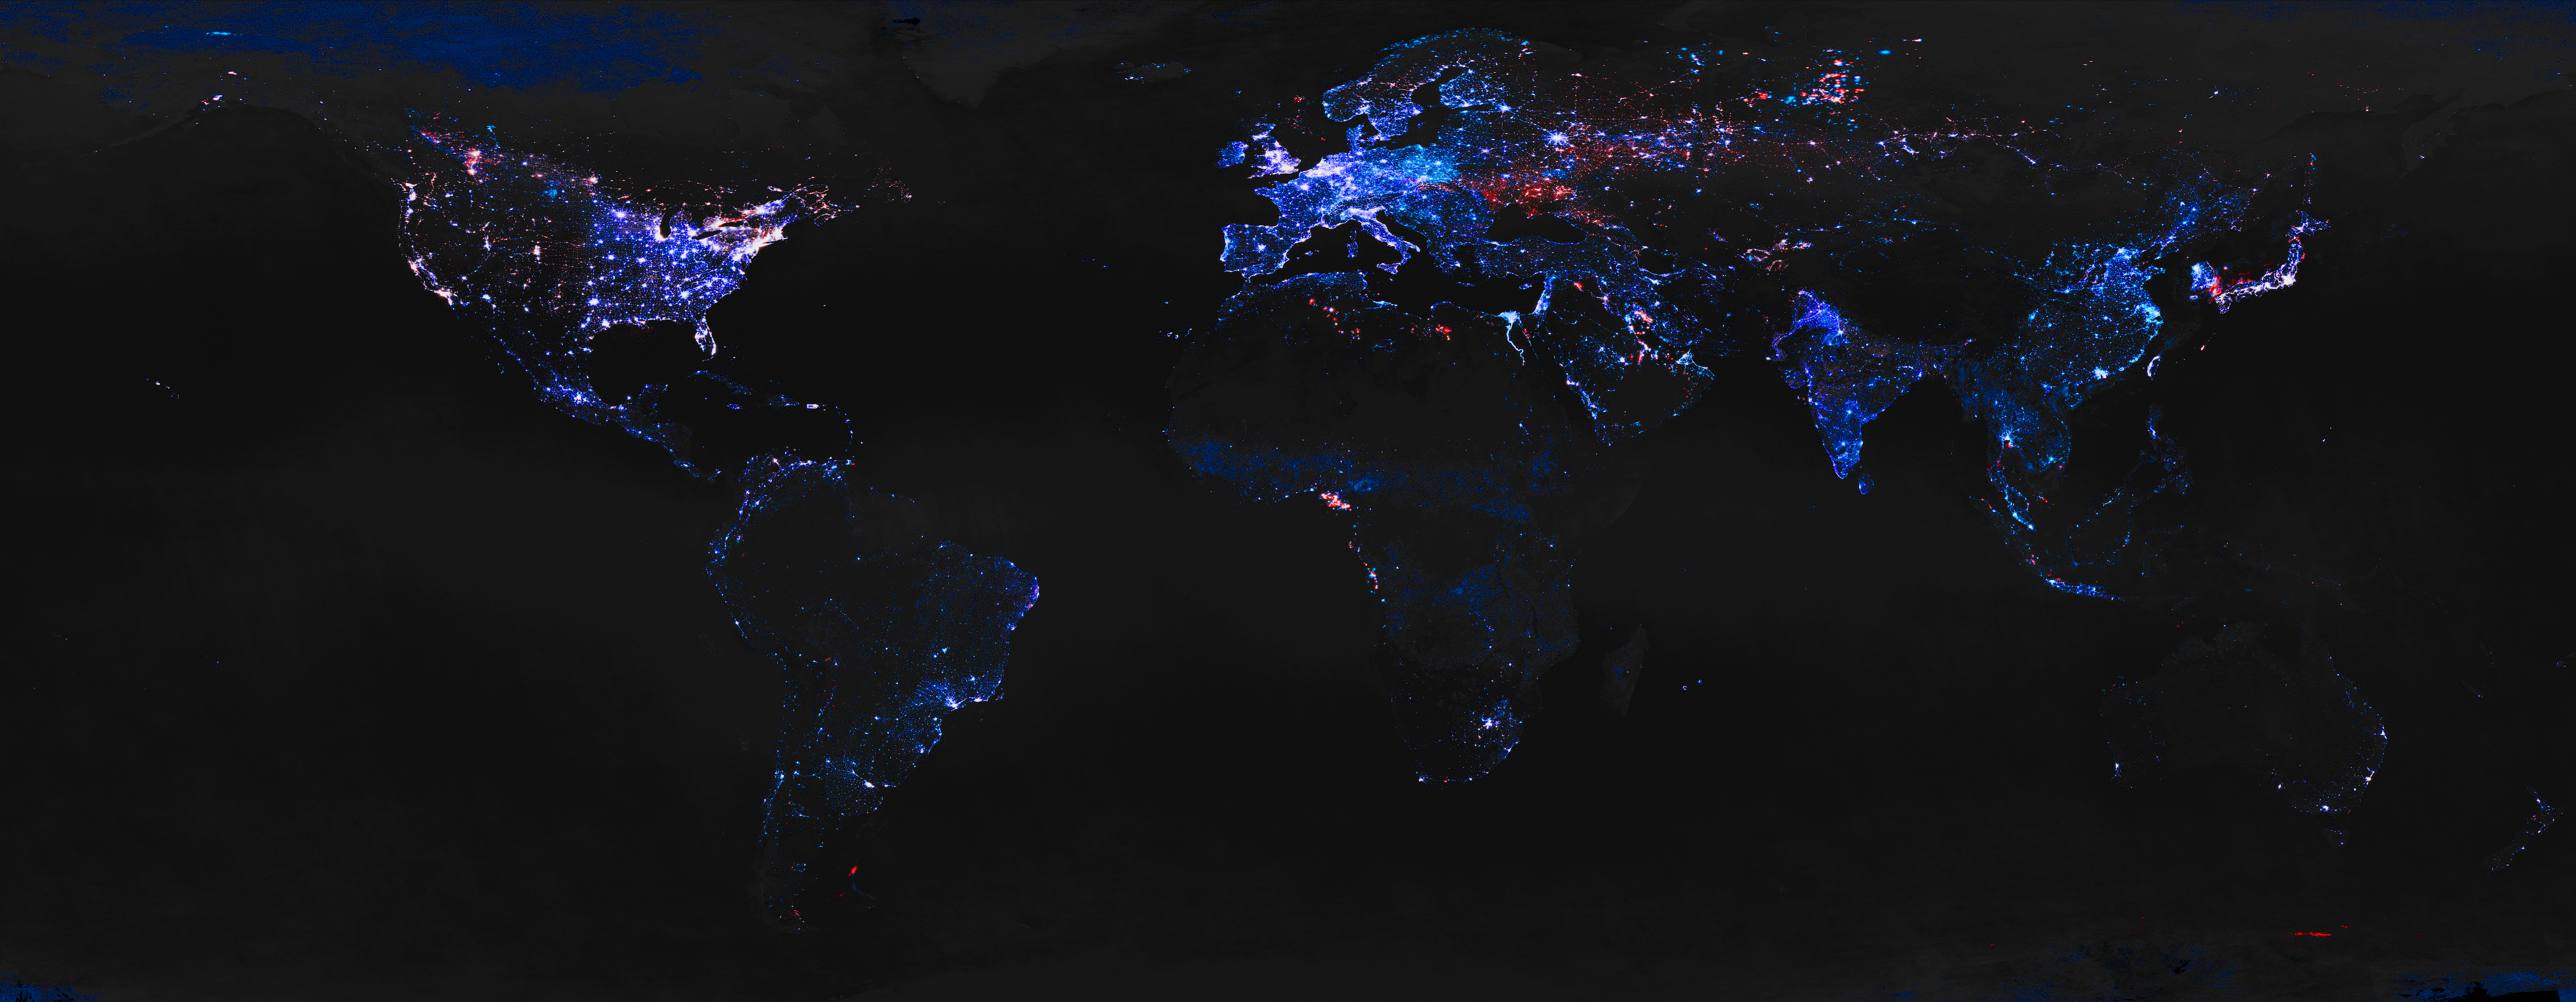
Above: The growth and recession of urban settlements between 1992 and 2010. Click for detail. Blue: newly illuminated citiesRed: cities that have lost electrical power |
This map was made by overlaying two publicly-available NASA maps showing light from cities at night. One map was recorded in 1992, the other in 2010. By overlaying and tinting them red and blue, respectively, we get a resulting map that reveals where urbanization has increased and declined over the last two decades.
The colors for this map were chosen in reference to astronomical light shifting — a phenomenon that scientists use to study distant stars and galaxies. Light shifting is like how the sound of cars change from high to low pitch as they drive past you. Sound shifting, also called the Doppler effect (also see Sonar), can tell you whether an object is approaching or moving away from you.
Light from distant objects also shifts as it moves. It travels much faster than sound, of course, so we don't perceive this effect with our eyes, but sophisticated telescopes (like the Herschel Space Observatory) can reveal these light shifts. Galaxies and stars moving towards us have compressed wavelengths (a blueish hue) while those moving away from us have longer wavelengths (reddish hues), like in this false-color image:
 Stephen Hawking famously described light shifting in his book, A Brief History of Time, where he explained how physicists used this theory to prove the Big Bang and the expansion of the universe.
 So, using light shifting as a metaphor, we created the map at the top of this page. Instead of depicting the night sky, though, we show the Earth's surface. The aim was to turn the awe and mystery of astronomy towards spaces closer to us. By producing new maps we hope to reimagine how we inhabit our planet and relate to others.
The earth has been thoroughly explored, documented, measured, categorized, photographed, partitioned, and traversed over the last few hundred years of scientific exploration. But there remain limitless numbers of new territories waiting to be produced, each with its own set of politics and possibilities.
This map is based on images from NASA's Earth at Night dataset. Higher resolution versions available. A similar technique was used in later projects by John Nelson and Dietmar Offenhuber.